Overview
This post is designed for beginners looking to dive into multi-threaded debugging.
Multi-threaded debugging is a powerful feature in Linx that simplifies debugging Services. Previously, multiple functions could not be debugged simultaneously. With this new feature, users can start and stop services during debugging, allowing them to debug various services and functions concurrently.
Learn more about Debugging Linx applications.
Getting Started
- Download the Sample
GraphQLServerWorkingSample.zip (39.4 KB) (Linx version 6.9.3)
The attached solution has GraphQLServer Service and a function GetBooks. The GetBooks function contains a GraphQL query that sends a query to get a list of books to the GraphQL server.
- Solution Overview
The solution includes theGraphQLServerService and a function calledGetBooks, which retrieves a list of books from the GraphQL server.
Steps to Use Multi-Threaded Debugging
-
Step 1: Start Debugging
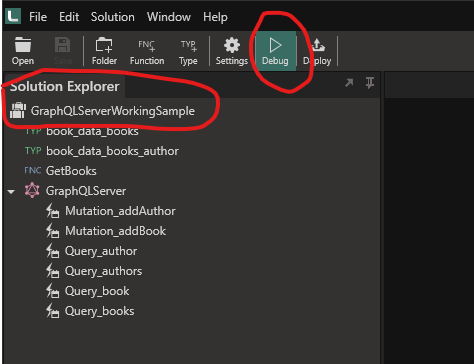
Right-click on the solution and click on Debug.

-
Step 2: Start the GraphQLServer Service
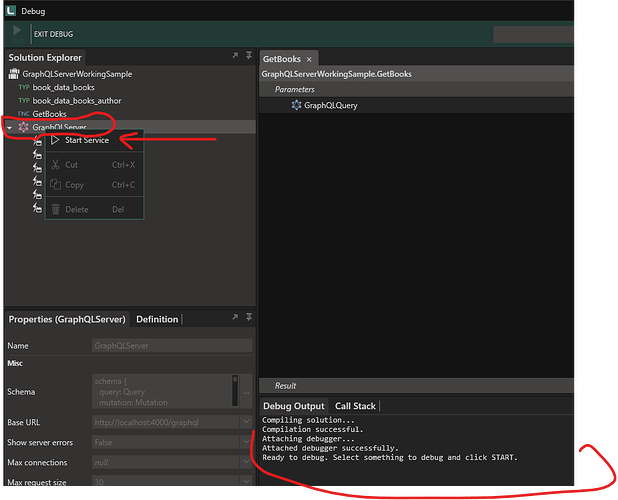
Once the debugger is attached, right-click on the service and click Start Service.
-
Step 3: Start debugging the Function
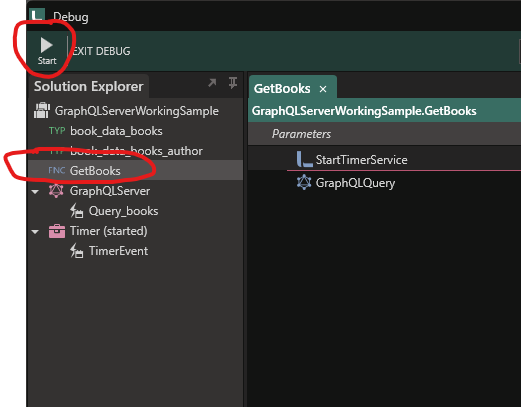
Click onGetBooksand then click Start.

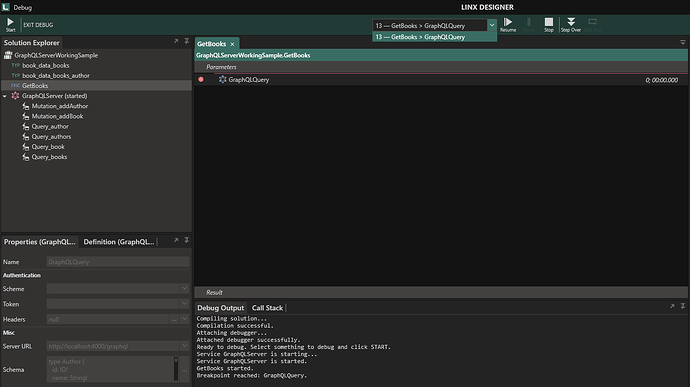
When you start to debug a function, a new thread is started. These threads are listed in the Thread dropdown in the toolbar at the top.
The selected item in the dropdown indicates the thread that is currently debugged.
- Step 4: Using Breakpoints
To Add a breakpoint, select the function you want to debug and press F9 or right-click on the function and select Add a breakpoint.
The image below shows a breakpoint inside theGetBooksfunction onGraphQLQuery.


